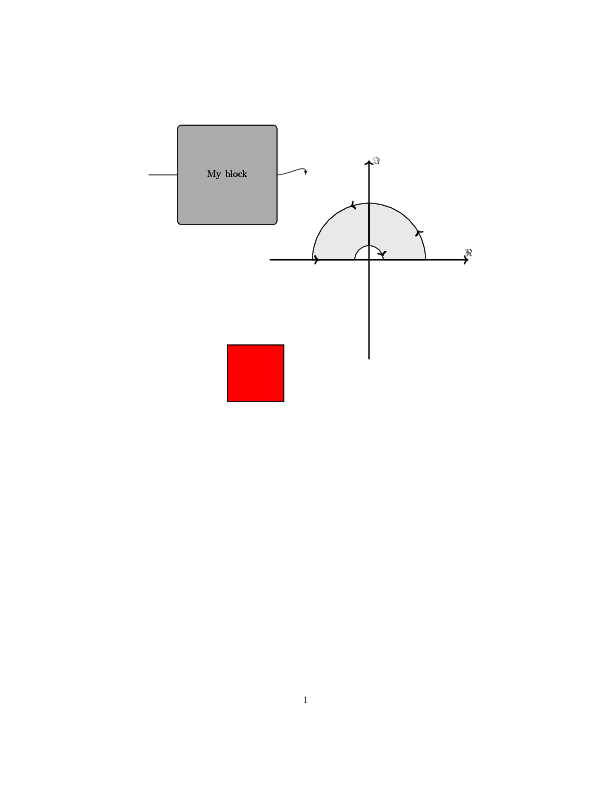
Tikzdraw example
This example shows TikZ drawing capabilities.
The code
from pythontikz import (Document, TikzPicture, TikzNode, TikzDraw,
                        TikzRectCoord,
                        TikzPolCoord, TikzCalcCoord,
                        TikzUserPath, TikzOptions, NoEscape, TikzScope,
                        TikzArc, TikzLibrary)


# create document
doc = Document()

# can manually add tikz libraries to document
# (some are detected automatically, like calc)
doc.preamble.append(TikzLibrary("arrows.meta"))
doc.preamble.append(TikzLibrary("decorations.markings"))

# add our sample drawings
with doc.create(TikzPicture()) as pic:

    # options for our node
    node_kwargs = {'align': 'center',
                   'minimum size': '100pt',
                   'fill': 'black!20'}

    # create our test node
    box = TikzNode(text='My block',
                   handle='box',
                   options=TikzOptions('draw',
                                       'rounded corners',
                                       **node_kwargs))

    # add to tikzpicture
    pic.append(box)

    # draw a few paths
    pic.append(TikzDraw([TikzRectCoord(0, -6),
                         'rectangle',
                         TikzRectCoord(2, -8)],
                        options=TikzOptions(fill='red')))

    # show use of anchor, relative coordinate
    pic.append(TikzDraw([box.west,
                         '--',
                         '++(-1,0)']))

    # demonstrate the use of the with syntax
    with pic.create(TikzDraw()) as path:

        # start at an anchor of the node
        path.append(box.east)

        # necessary here because 'in' is a python keyword
        path_options = {'in': 90, 'out': 0}
        path.append(TikzUserPath('edge',
                                 TikzOptions('-latex', **path_options)))
        path.append(TikzRectCoord(1, 0, relative=True))

    # Demonstrate use of arc syntax and \coordinate variables with
    # TikZ Scopes. Example is drawing an integration contour diagram
    # with an isolated singularity:

    # define a coordinate so that we can reposition the origin easily
    # after the latex is produced
    orig = TikzCalcCoord(handle="orig", at=TikzRectCoord(5, -3))
    orig_handle = orig.get_handle()  # handle label to coordinate
    pic.append(orig)  # add definition of coordinate

    # demonstrate use of tikz scopes
    scope_options = TikzOptions(
        NoEscape("decoration={markings," "\n" r"mark=between positions 0.1"
                 r" and 0.9 step 0.25 with {\arrow[very thick]{>}},}"
                 "\n"), shift=orig_handle, scale=2)

    with doc.create(TikzScope(options=scope_options)) as scope:
        draw_options = TikzOptions(fill="gray!10", postaction="decorate", )
        rad = 1
        sing_rad = 0.25
        # angle constants
        s = 0
        f = 180
        scope.append(
            TikzDraw([TikzPolCoord(angle=s, radius=rad),
                      'arc', TikzArc(s, f, rad),
                      '--', TikzPolCoord(f, sing_rad),
                      'arc', TikzArc(f, s, sing_rad),
                      '--', 'cycle'],  # close shape with cycle
                     options=draw_options))

    # demonstrate the use of \coordinate variables without scope

    # (Add an axis to diagram):

    rad = 3.5
    draw_options = TikzOptions("very thick", "->")
    # can handle addition/ subtraction between coordinate handle
    # & explicit coordinate object.

    # can also use node in draw inline context
    pic.append(TikzDraw([orig_handle + TikzRectCoord(-rad, 0), '--',
                         orig_handle + TikzRectCoord(rad, 0),
                         TikzNode(text=NoEscape(r"{$\Re$}"),
                                  options=['above'])],
                        options=draw_options))
    pic.append(TikzDraw([orig_handle + TikzRectCoord(0, -rad), '--',
                         orig_handle + TikzRectCoord(0, rad),
                         TikzNode(text=NoEscape(r"{$\Im$}"),
                                  options=['right'])],
                        options=draw_options))

if __name__ == "__main__":
    doc.generate_pdf('tikzdraw', clean_tex=False)
The generated files
tikzdraw.tex
1 2 3 4 5 6 7 8 9 10 11 12 13 14 15 16 17 18 19 20 21 22 23 24 25 26 27 28 29 | \documentclass{article}%
\usepackage[T1]{fontenc}%
\usepackage[utf8]{inputenc}%
\usepackage{lmodern}%
\usepackage{textcomp}%
\usepackage{lastpage}%
\usepackage{tikz}%
\usetikzlibrary{calc}%
%
\usetikzlibrary{arrows.meta}%
\usetikzlibrary{decorations.markings}%
%
\begin{document}%
\normalsize%
\begin{tikzpicture}%
\node[draw,rounded corners,align=center,minimum size=100pt,fill=black!20] (box) {My block};%
\draw[fill=red] (0.0,-6.0) rectangle (2.0,-8.0);%
\draw (box.west) -- ++(-1.0,0.0);%
\draw (box.east) edge[-latex,in=90,out=0] ++(1.0,0.0);%
\coordinate (orig) at (5.0,-3.0);%
\begin{scope}[decoration={markings,
mark=between positions 0.1 and 0.9 step 0.25 with {\arrow[very thick]{>}},}
,shift=(orig),scale=2]%
\draw[fill=gray!10,postaction=decorate] (0.0:1.0) arc (0.0:180.0:1.0) -- (180.0:0.25) arc (180.0:0.0:0.25) -- cycle;%
\end{scope}%
\draw[very thick,->] ($ (orig) + (-3.5,0.0) $) -- ($ (orig) + (3.5,0.0) $) node[above] {{$\Re$}};%
\draw[very thick,->] ($ (orig) + (0.0,-3.5) $) -- ($ (orig) + (0.0,3.5) $) node[right] {{$\Im$}};%
\end{tikzpicture}%
\end{document}
|
tikzdraw.pdf